14
Apr
2025

In Regan Capital’s view, the often-overlooked residential mortgage-backed securities (“RMBS”) market offers a far better risk/reward trade-off than any other sector of the fixed-income markets. This perspective is supported by many of the world’s top fixed income managers. While it may not always be apparent to investors, many of the largest active fixed income mutual funds are dramatically overweight mortgages. We looked at 40 of the largest active fixed income mutual funds by AUM, that together make up over $1.6tn in assets, and found that the average allocation to MBS amongst these funds is over 46%. That’s almost 20% higher than their next largest allocation (corporates, 27%).
RMBS is one of the only asset classes that becomes safer as it approaches maturity as mortgages amortize over time. As borrowers make their monthly mortgage payment, the loans backing RMBS de-risk via principal paydown and home equity growth. Principal and interest cash flows are returned to RMBS investors, allowing their holdings to de-leverage and giving them the opportunity to reinvest the proceeds. The return of cash flows can continually be redeployed, enabling superior compounding and income generation. In contrast, traditional fixed-income vehicles, such as sovereign, corporate and municipal debt, become riskier as the obligations come due as issuers often must pay off the debt in full at maturity rather than over time (also known as balloon risk or refinance risk). The unique structure of RMBS provide flexibility in managing interest rate, credit and reinvestment risk within fixed-income portfolios. There are instances, based on the shape of the yield curve, where it would be beneficial to own bullet bonds versus amortizing bonds. However, this benefit must be weighed against the additional credit risk that comes with bullet bonds.
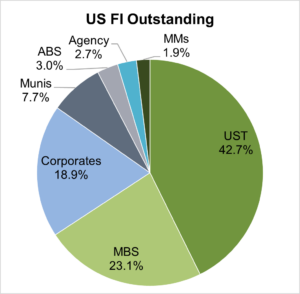
With total MBS issuance up significantly through 2024, the US residential real estate market remains one of the largest and fastest-growing markets in the world. $12.2 trillion of the existing mortgage market is held in RMBS, making it the second largest fixed income sector behind only US Treasuries.
With an estimated $1.9 trillion in new mortgages originations expected in 2020, the US residential real estate market is one of the largest markets in the world. $10.3 trillion of the existing mortgage market is held in RMBS, second only to the US Treasury market.
Source: SIFMA.org
Approximately $8.8 trillion of the market is classified as Agency RMBS, while $1.5 trillion falls under non-agency RMBS. This primer will serve to lay out the enormous opportunity that exists in the US mortgage market and illustrate how an investor can concurrently add cashflow, reduce duration risk and ultimately add desirable diversification within a broader fixed income allocation.
For the past 40 years, bond investors have benefited from a secular tailwind in the form of steadily falling interest rates. Without making any predictions about the future path of interest rates, it is fair to conclude that the likelihood of this tailwind continuing is low. Rates have recently risen from ‘zero bound’ in one of the fastest moving rise in interest rates and largest drawdowns for the bond market in history.
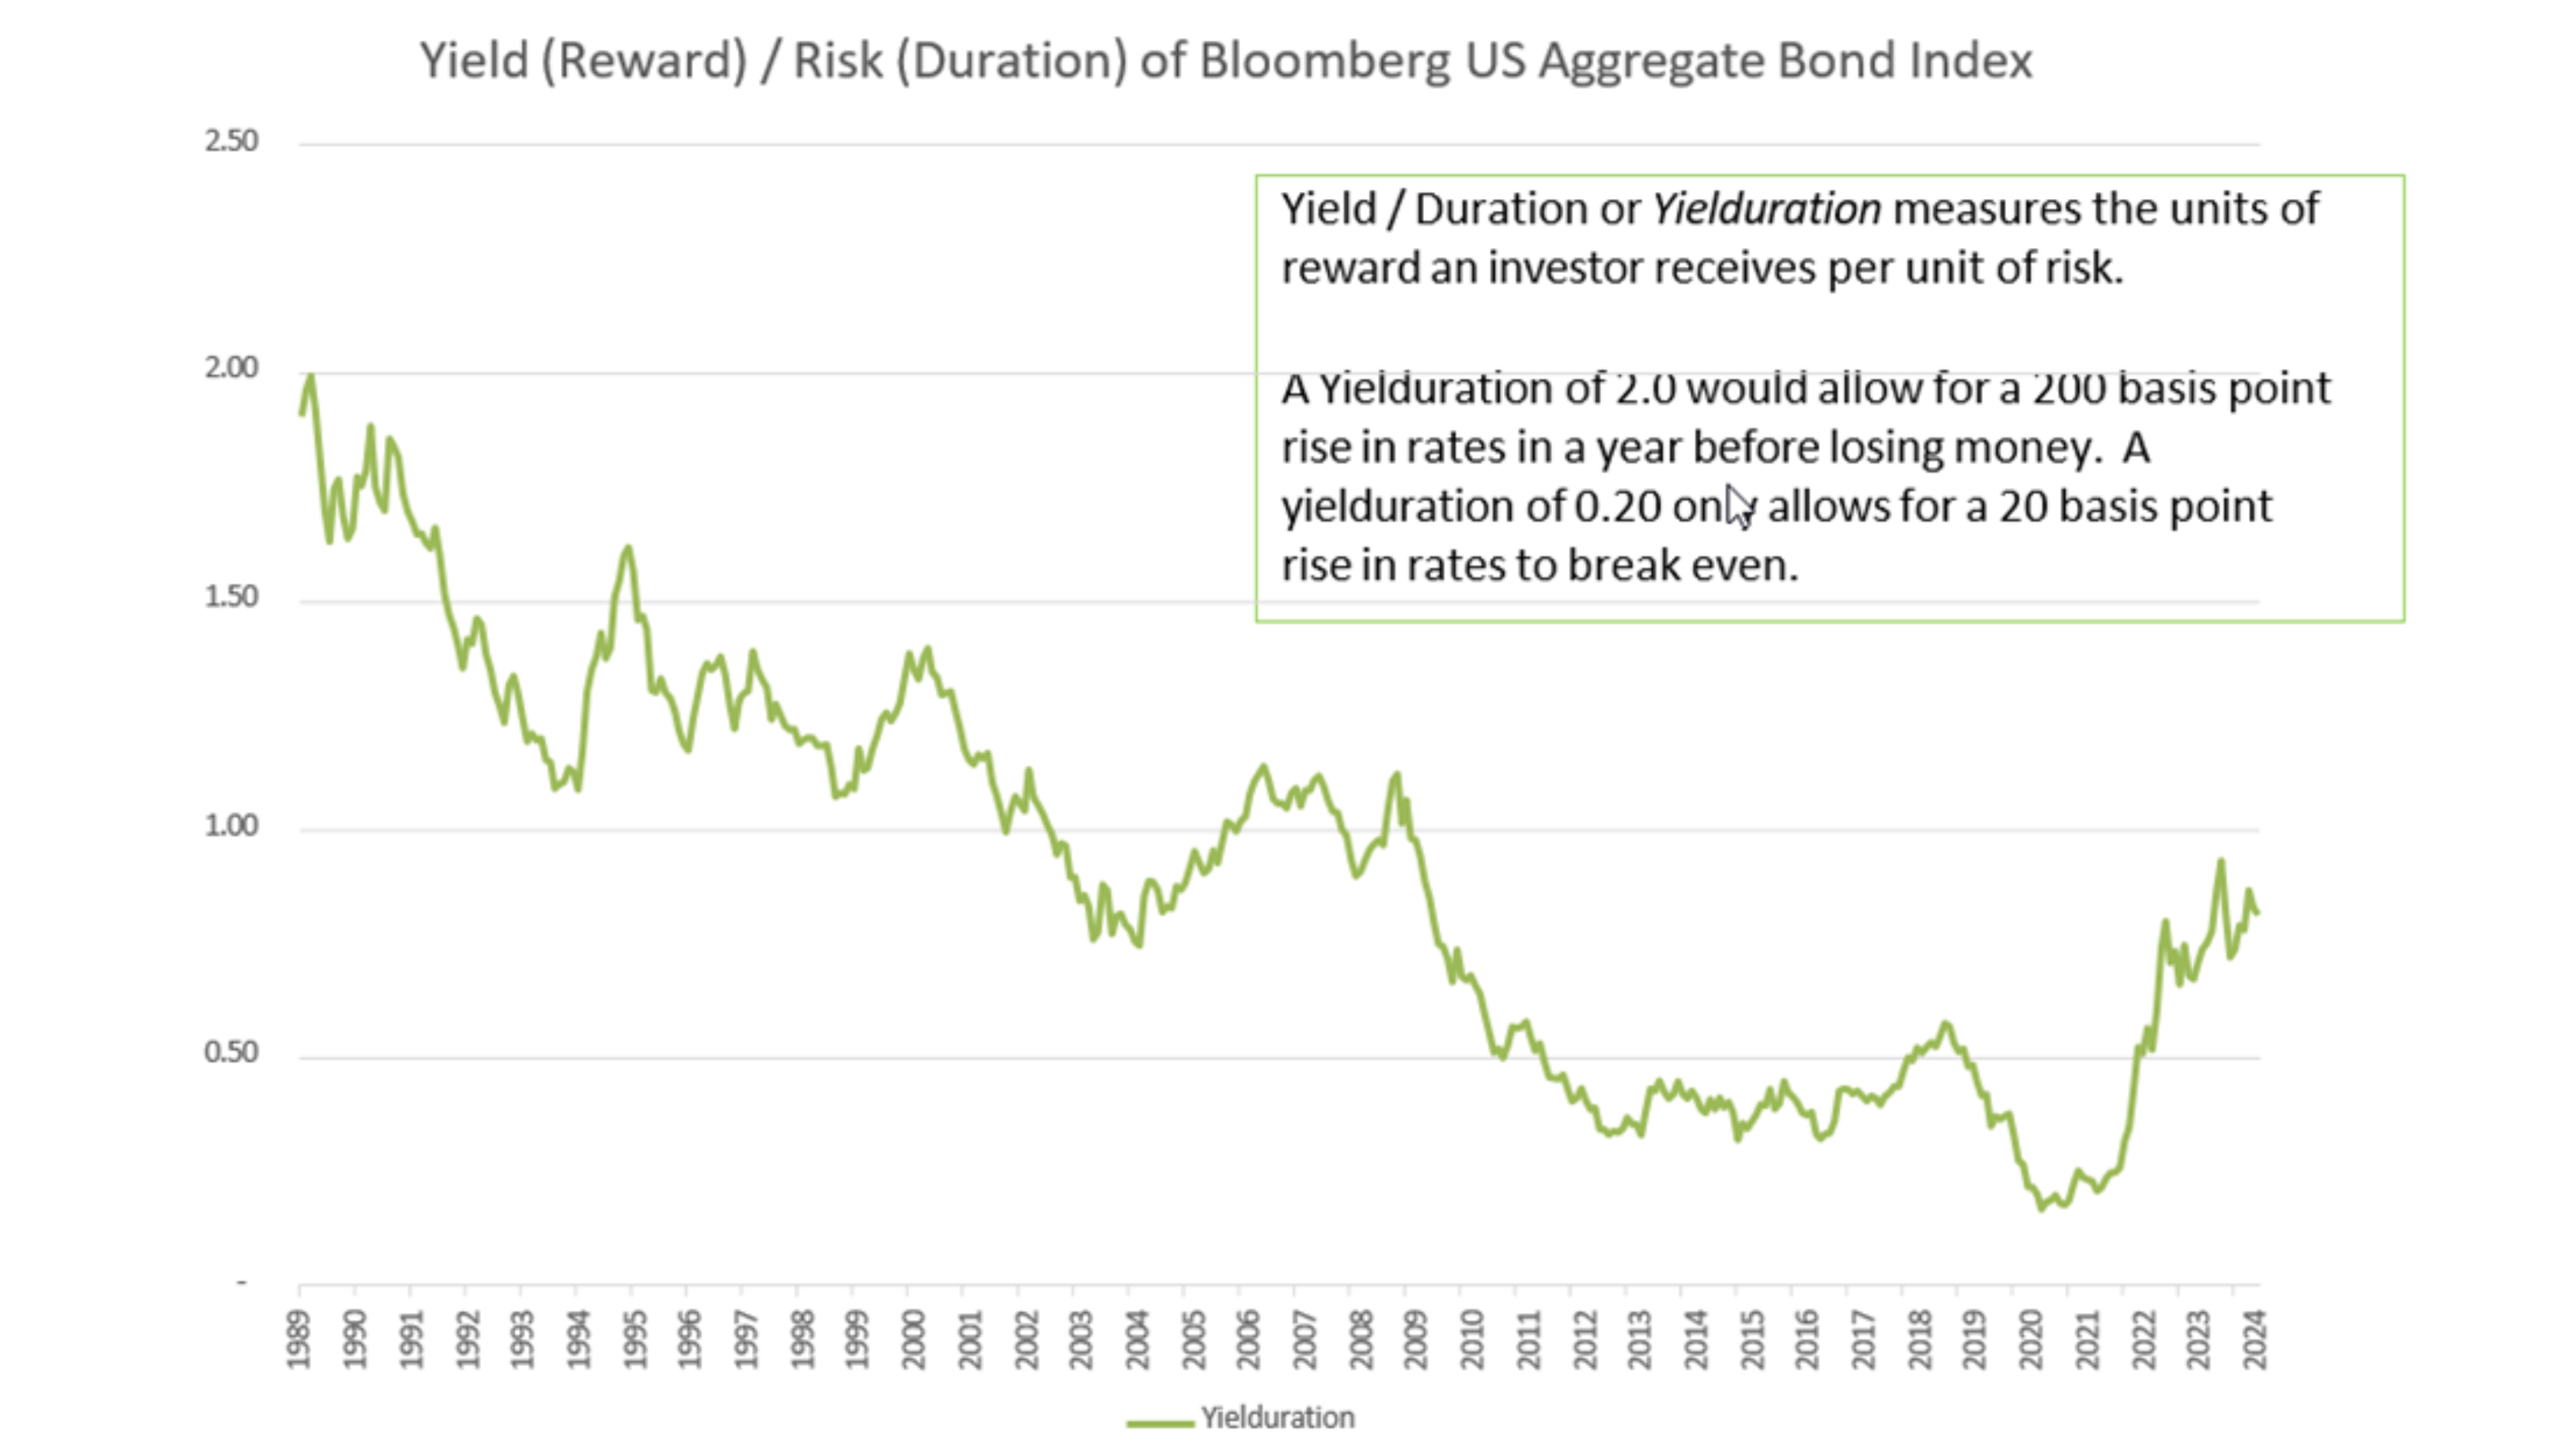
Regan Capital uses a measure we have termed “Yielduration” to quantify the benefit of holding duration. This measure is simply the yield-to-maturity divided by the duration of the instrument, showing the reward investors earn for a unit of duration risk.
As we can see in the chart below the “Yielduration” has increased recently but remains historically low meaning that investors are still not earning a historically meaningful return for taking duration risk. A yielduration of 1.0, would mean an investor is getting one unit of yield for taking on one unit of interest rate risk. Investors should prefer a yielduration of at least 1.0 in order to take on risk.
Another common strategy that investors use to manage duration risk is what is commonly known as a “bond ladder”. This is where an investor looking for regular income buys fixed-rate bonds that mature in regular intervals to fund future expenses. This strategy allows investors to manage the cash flow profile of their investment portfolio to support their future liabilities or investment goals. With fixed-rate, floating-rate, bullet, amortizing, and callable bonds now widely available in the fixed-income market, investors have even greater flexibility to build portfolios tailored to their unique cash flow needs. This adds another important dimension to portfolio diversification.
The shape of the yield curve often reflects investors’ expectations for the future path of interest rates. For example, when the curve is inverted it is a sign that investors expect lower interest rates in the future. While amortizing bonds may benefit from an inverted yield curve they will not benefit as much from the expected drop in interest rates as they generally exhibit shorter duration. However, there is a tradeoff that investors face between how much lower of a yield they accept for the extra duration and the benefit they get from amortizing bonds in an inverted curve environment. When weighing these tradeoffs investors can find that the benefits of compounding returns can make up a significant portion of yield differential that investors accept for taking duration risk. This means that amortizing bonds offer highly certain advantages over non-amortizing bonds in terms of managing duration risk.
In 2024, the market provided a great case study for managing a bond portfolio in an inverted yield curve environment. Most fixed income investors were certain the Fed would lower rates and bid up longer duration bonds to the point where mathematically it was highly probable that even if the Fed did lower rates, longer-duration bonds would not provide higher returns than shorter-duration bonds. Not only did that occur, but after the Fed lowered rates, longer-duration bonds decreased in price as the Fed disappointed market expectations for how much their influence on the front end of the curve would impact longer tenor securities.
Another advantage that amortizing bonds provide comes in the form of lower credit risk. When borrowers repay their indebtedness over time, credit risk decreases as the bonds deleverage. Not only do investors have less absolute credit risk exposure, but also the exposure they have is higher quality, all else being equal, as the borrower has increased their equity position.
Credit risk in fixed income comes from the borrower’s ability to repay their indebtedness and is closely tied to the economy. When the economy contracts, we see borrowers, both corporations and individuals, default on their debt which directly impacts fixed income investors who own those bonds. When the economy is strong, investors receive an equivalent interest rate for taking on less credit risk.
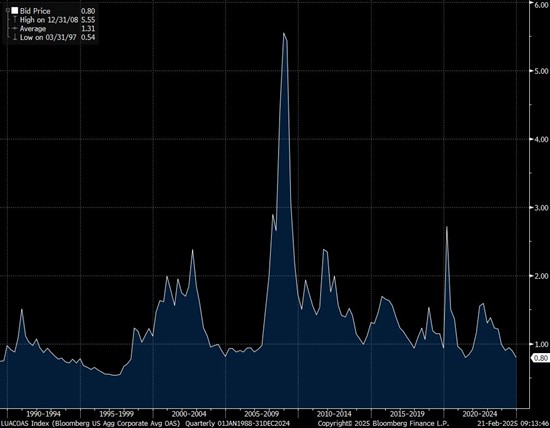
At present, corporate bond risk premium is historically low as the economy has been strong, equity valuations are high, and equity investors have been moving into the relative “safety” of corporate bonds, which are higher in the capital structure than equities.
There is credit risk in the MBS market as well which comes in the form of different Non-Agency MBS. These bonds are backed by different types of loans to homeowners and secured by the real estate. Credit risk for secured bonds is generally lower than for unsecured bonds as borrowers possess equity in their homes, which can be seized and sold upon borrower default.
Convexity risk arises from the fact that a bond’s duration is not constant and changes as interest rates change. Convexity measures how much a bond’s duration changes for a change in interest rates and characteristics like the bond price, coupon, maturity, the ability for the borrower to prepay early, and whether the bond is amortizing or non-amortizing determine the convexity of a bond.
Of all the characteristics that determine the convexity of a bond the biggest factor is the ability for the borrower to prepay early, also know as “optionality.” If the borrower has the option to prepay, the bond’s convexity will change, based on the price at which it trades. For a bond that trades at or above $100, that bond will not increase in price as interest rates fall as much as it’s duration would imply, given the borrower has the option to refinance their loan at a lower rate. Additionally, it will drop in price faster as interest rates rise, given their option to refinance is then non-economical. If the bond were to trade at significant discounts from $100, as it true of the bulk of RMBS today, it would display positive convexity. That is, positive asymmetry to interest rate movements. Given a drop in interest rates, the bond would increase in price at a greater value than its treasury node or duration would imply. If rates were to rise, it would fall less or the equivalent to its duration. Given that most mortgage bonds and all new issue bonds trade at or close to $100, RMBS offer higher yields to compensate for negative convexity.
If interest rates do not change much, the investor will get the premium and not have to bear the cost of negative convexity. However, if rates move more than expected they will experience losses that offset that extra yield premium. In this way, negative convexity is a bet on the volatility of interest rates.
One of the primary determinants of the volatility of interest rates is the shape of the yield curve. Since the yield curve reflects investor expectations for future interest rates it is also a good measure of interest rate volatility. An inverted or steep yield curve tends to cause interest rate volatility to rise as the market expects interest rates to change. When the curve is flat, or only slightly steep or inverted, interest rate volatility tends to be lower as investors do not expect interest rates to change much.
Today, the yield curve is mildly inverted, and interest rate volatility is higher which has caused the valuation of negatively convex bonds like Par-area MBS to suffer. MBS spreads are historically high relative to corporate bond spreads. The market is pricing convexity risk cheaply and credit risk expensively.
Mortgage-backed securities (MBS) are callable as each underlying mortgage loan can be prepaid at any time. When interest rate volatility is high, the value of those prepayment options increases, which decreases the value of the MBS. However, the amortizing nature of MBS, along with the callability, provides much more cash flow flexibility than typical callable bonds. This flexibility provides investors with additional options for managing the cash flow profile of their investment portfolios.
The mortgage market, in security form, started with the founding of Ginnie Mae in 1968. From 1934 to 1968, the government had been involved in mortgage finance by purchasing individual mortgages from banks and originators via the Federal Housing Administration (FHA). Ginnie Mae issued the first MBS product in 1970. Mortgage pools or “pass-throughs” are a group of individual mortgage loans, pooled together, where the cash flows of the underlying mortgages pass through to the investors. Timely payment of interest and principal are guaranteed by the government owned (Ginnie Mae) or sponsored (Fannie Mae and Freddie Mac) issuer. As the underlying borrowers take out 30-year fixed-rate, amortizing mortgages, but have the option to prepay their mortgage at any time, it’s difficult for an investor to model out precise cashflows of their investment. Unlike a bullet security, where interest payments are made twice per year and principal is paid upon final maturity, mortgage bonds pay interest and regularly scheduled principal monthly, whereas unscheduled principal can come at any time through curtailment, loan payoff or default. For these reasons, it took some time for institutional investors to embrace mortgage bond investing. The complexities involved in modeling and accounting for these cashflows is one of the primary reasons why mortgage bonds continue to trade at higher premiums to corporate bonds.
To provide greater transparency around the timing of cashflows, the first mortgage-backed securitizations were created by Wall Street investment banks in the 1980s in the form of CMOs (“Collateralized Mortgage Obligations”). CMOs allow investors to participate in specific parts of the mortgage life cycle. A broker-dealer or investment bank could purchase mortgage pass-throughs and structure securities that would transform interest and principal repayment into multiple layers, assigning each layer a specific priority to receive principal distributions. An investor looking for a short-term investment, such as a bank, could participate in the tranche designed to pay back principal the earliest. Another investor, such as an insurance company with a long-term investment horizon, may prefer a longer stream of interest payments before receiving any principal and could purchase a security with a lower priority of principal repayment. This novel concept of “time-tranching” cash flows, which enables investors to pick and choose their preferred cash flow profile, paved the way for what would eventually become a multi-trillion dollar industry.
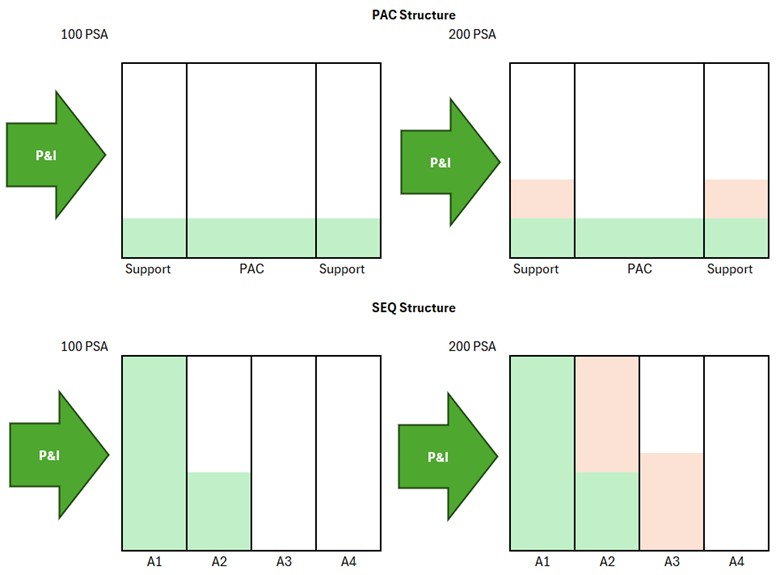
In this example, we see the two primary structures in the Agency MBS market: PAC and Sequential structures. PAC bonds are structured so that their cashflows and maturities are very stable, with the support bonds absorbing all the variability in cashflows. This allows PAC bond investors to buy a mortgage bond that is very similar to a corporate bond with a fixed maturity date.
The sequential structure allocates cashflows in sequence for different tranches which has the effect of making the first tranches in the sequence the shortest duration and the last tranches in the sequence the longest, since they have to wait for every tranche in front of it to be paid off before they get their principal back. All tranches receive regular interest payments at the same time.
Non-agency mortgages are the original form of private credit. Prior to the formation of the FHA in 1934, mortgage lending was practically illegal by US Banks. Dating back to Adam Smith and John Law, who wrote in the 1705, around the “real bills doctrine,” which stipulated that banks couldn’t lend with maturities greater than 90 days. Not much changed between the 1700s the Great Depression in the United States in the early 1930s. Mortgage loans rarely had LTVs (loan-to-values) greater than 50%, were generally shorter in length (5 to 10 years) and were primarily financed by co-operatives or savings and loan institutions, which were not guaranteed by the government. Up through 1934, we witnessed numerous bank failures resulting from sour loans and/or a mismatch between borrowing short and lending long. As the FHA was born in 1934, banks could originate loans locally and either have them insured federally and/or sell those loans to the government and/or other savings institutions. Banks were then able to purchase government guaranteed mortgages and eventually mortgage bonds, with broader geographical diversification than what they had access to locally.
While the Federal loan agencies became the biggest game in town, non-guaranteed mortgage loans continued to survive. Not every borrower was eligible for government guaranteed home loans. Mortgage size limits are set annually as are underwriting specifications around income, credit scores and borrower equity. For those borrowers that cannot meet agency guidelines, non-agency or “private label” mortgage are available, for those that qualify. Private label mortgages generally come with an added cost or coupon to be borne by the borrower.
As the RMBS investor base grew, non-agency mortgages were also used to create RMBS securities. Previously, loans that did not conform to the housing agencies’ guidelines were made by traditional lenders and held on bank or originator balance sheets. The advent of the CMO market provided a new source of liquidity for these lenders and allowed more investors to participate in the mortgage market. Historically, it was challenging to originate these loans, and the documentation required to underwrite and hold these loans on balance sheets was a major impediment to investing in these assets. CMO technology effectively opened the door for a whole new market of borrowers and lenders to emerge.
Non-agency RMBS investors include, but are not limited to, traditional money managers, mutual funds, hedge funds, real estate investment trusts, banks, and insurance companies. These investors are not traditional mortgage lenders, but through the RMBS market, they are able to gain access to the massive mortgage market, increasing diversification and risk-adjusted returns.
Non-agency RMBS investments are like Agency RMBS in every characteristic, but they also include a credit risk component. With Agency RMBS, the housing agencies take this risk in exchange for a fee, but with non-agency RMBS, investors can earn a higher yield for taking credit risk.
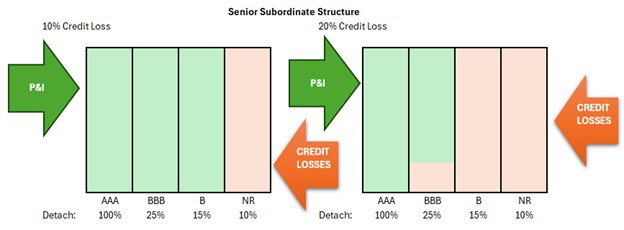
Similar to how Agency MBS are structured to provide different duration profiles, Non-Agency MBS are structured around the additional element of credit risk. The primary method for credit tranching is creating a senior-subordinated structure like the one pictured above. This is almost identical to the sequential structure in Agency MBS except that in this case the bonds are ordered in terms of priority of getting principal and losses. Principal is paid to the highest priority tranches first and are the last to take losses. Losses are taken by the lowest priority traches first and they are also the last to receive principal. This allows investment banks to take a pool of loans with an average credit rating of investment grade and create investment grade and non-investment grade bonds to sell to investors with different risk appetites.
The primary determinant of the credit risk within non-agency RMBS is the collateral that secures the loans.
The non-agency mortgage market is comprised of a multitude of loan types, each of which comes with various risks and mitigants. At the loan level, an investor is constantly considering many factors, including credit score, loan size, geography, and borrower payment history, among other things. Since RMBS investors can ultimately take a view on both collateral and structure, a focused, bottom-up analysis is crucial to understanding where the best risks and rewards lie. Only after a thorough analysis of the underlying loan pool characteristics should an investor decide if they will participate in a deal, what level of tranche risk they are willing to take, and if they are being adequately compensated for that risk. We will discuss at a high level the subsectors that make up most of the currently investable universe.
The legacy non-agency market refers to transactions that were completed prior to the 2008 financial crisis. Most of the currently tradable universe in this sector was created between 2005 and 2007, during the peak of the housing bubble. We typically tier legacy collateral into three buckets based on FICO:
Jumbo loans exceed the conforming loan limits set by the Federal Housing Finance Authority (FHFA) and therefore do not qualify to be guaranteed by the housing agencies. The conforming limit for 2025 is $806,500 for single-family homes and is revised annually by the FHFA based on changes in average home prices nationally.
Issuance for Prime 2.0 deals is expected to exceed $25bn in 2025.. The new issuance private label securitization market went into a long period of hibernation after the financial crisis. It took years for investors to digest the immense dislocation that occurred in legacy non-agency and analyze many of the underwriting shortfalls and systemic leverage that caused the sector to implode in the first place. New loans were being originated; however, lenders severely tightened up lending standards for new mortgages which they were to hold on their balance sheets. The requirements for these loans typically fit the underwriting standards required by the agencies, aside from loan size. The main drivers of risk such as debt-to-income, FICO, employment and asset verification, and proper appraisals were paramount to approving or turning down a new mortgage application.
Aside from better loan underwriting, the structural improvements protecting investors in 2.0 non-agency bonds from losses were vastly improved as well. This came in the form of higher subordination for senior noteholders and more stringent deal covenants. Prior to 2008, new issue deals assumed very low potential losses in loan pools during a prolonged housing bubble, thus providing fewer protections for bondholders as investor demand persisted. The market has learned from those mistakes, and senior bond holders of new-issue deals are much more insulated from credit losses.
Within the Prime Jumbo 2.0 category there is a specific cohort of loans made on investment properties. These loans generally carry a higher risk due to the nature of investment properties. As these properties are not owner-occupied and carry additional risks, lenders typically require higher borrower FICO scores, lower debt-to-income, and borrowers must evidence sufficient income and assets to manage the loan payments. Finally, lenders are likely to require higher down payments and charge higher interest rates for Investor loans.
In 2010, the government created Ability-to-Repay (“ATR”) standards under the Dodd-Frank Wall Street Reform and Consumer Protection Act. It required mortgage lenders to make good faith determination of a borrower’s ability to meet their mortgage obligations. Subsequently, in 2014, the Consumer Financial Protection Bureau (CFPB) created the concept of Qualified Mortgages (“QM”). QM Loans were meant to protect borrowers from predatory lending behavior and provide legal protection for lenders that complied with the new standards put in place. To be considered a QM, the criteria below would have to be met:
After QM standards were put in place, there was still a large subset of borrowers that did not fit onto the QM box; that ultimately fell into the non-QM category. The borrowers were not necessarily high risk or a modern-day equivalent to subprime borrowers, they just did not fall into the more stringent QM standards for various reasons. Some non-QM loan characteristics include:
This gap in the market brought a host of new private lenders looking to fill the void created by QM standards. The non-QM product has become an integral part of the mortgage origination market due to the flexibility it provides for specific borrowers. The securitizations that have followed have been well received by the investment community as it has become more comfortable with the underwriting and structuring standards.
In 2013, Fannie Mae and Freddie Mac began issuing Credit Risk Transfer (“CRT”) deals to the private market. CRT allows investors to access a structured investment in agency-conforming mortgages with a higher return than traditional agency CMOs. The loans in the program are underwritten according to the usual agency guidelines. However, rather than guaranteeing the credit risk in full using taxpayer money (as they would in a traditional Agency CMO), the agency is able to effectively offload part of the risk to private investors by paying them to take on the credit risk. Like other RMBS we have discussed, bonds are created in a senior-subordinate structure, allowing investors to participate at varying levels of risk. Each CRT transaction corresponds to a pool of approximately 100,000 mortgages. Bondholders receive interest on the bond they participate in, commensurate with the level of seniority of their respective tranche. If losses occur in the underlying mortgages, losses in the CRT deal are allocated to the junior-most tranches first, then make their way up the capital structure. Principal repayments are paid top down, benefiting the senior most investors first. In order to continually keep the agencies’ interests aligned with investors, the agencies retain a portion of each tranche they create as well. This is treated as ‘skin in the game’, giving investors additional comfort in the quality of the loans and CRT structure being presented. Since the inception of the program, the agencies have issued bonds referencing over $3.4 trillion in mortgage loan balances.
The aftermath of the 2008 financial crisis left many lenders with distressed loans on their balance sheets. Even though many loans created before 2008 were subsequently put into an RMBS transaction, lenders were still left holding loans that were never securitized. As of 2016, the size of the outstanding NPL/RPL loans was a whopping $400 billion, held between money center banks, regional banks, GSEs, and the US Department of Housing and Urban Development. Due to stringent capital and regulatory restrictions, it was onerous for these entities to continue holding these loans while an optimal resolution for distressed homeowners was reached. To alleviate this, lenders began selling these distressed loan portfolios at steep discounts to investors who are less constrained by regulations. Investors can spend more time and resources working these loans out in a more economical way. The goal for investors is to extract value from these loans using three main tools:
To help finance the purchase of these large pools of loans, loan investors began to issue RMBS backed by the NPL/RPL loans. The simple structure issued one to two senior notes that represented approximately 50% of the transaction. The remaining 50% would be comprised of subordinated bonds that the issuer would retain. When loans are monetized using one of the three methods described above, investors receive principal back in the same top-down priority characteristic of other types of RMBS. The issuer does not receive any principal on their retained junior tranche until the senior holders are fully repaid. Additionally, if the value of the purchased loans is deemed to be lower than the initial purchase price, losses are first applied to the junior tranches. Therefore, it is in their continued best interest to successfully figure out how to monetize the loans they securitize in these transactions.
The Single-Family Rental (“SFR”) market was established in 2013 to finance the burgeoning market for detached single-family rental properties. Traditionally, investors seeking large-scale exposure to residential rental property cash flows participated by owning multifamily assets, such as apartment buildings rented out to individual tenants, while structured product investors accessed these cash flows through Commercial Mortgage- Backed Securities (CMBS). Because of its focus on rental cash flow yields, multifamily has fallen into the category of commercial rather than residential property for the purposes of loan underwriting and securitization. After 2008, there was a massive glut of homes where homeowners either defaulted on their mortgages or simply walked away. While the economy began to recover, many individuals either did not qualify for a mortgage under more stringent underwriting guidelines or could not afford to purchase a home. This created an enormous opportunity for institutional investment firms to purchase large portfolios of single-family detached homes, something the market had never seen before. Large institutions were able to purchase entire portfolios of homes in cash with very short closing timelines. This added a large amount of much-needed liquidity to the housing market at a time when loan origination seized up, consumers were under enormous pressure, and massive amounts of vacant inventory were left sitting on the market. There was a dramatic shift in demand toward renting single-family homes that had historically been purchased as primary residences. The SFR market eventually emerged as a vehicle to securitize loans created to finance these larger-scale home purchases.
Investors in SFR RMBS receive interest and principal on their bonds. However, a key distinction is that the monthly cashflows are derived from rental income on income-producing real estate, and principal proceeds are not paid in full until the borrower refinances or sells an underlying property in the portfolio. Because of this distinct characteristic, SFR is best viewed as a hybrid of residential and commercial investing. This sector differs from other RMBS in how its cash flows are derived and is better suited for analysis using a commercial real estate investment framework that focuses on rental yields, debt service coverage, and vacancy rates. Nevertheless, we include it in our discussion since the underlying assets are still residential homes that derive value, liquidity, and risks associated with traditional residential housing.
So far, we have discussed loans that are secured by a first mortgage on residential real estate. There are also loans that are secured by subordinated interests in real estate such as second mortgages and home equity loans.
Second mortgages are a subordinated mortgage on the same residential property as another first mortgage. Like the senior subordinated structure we have previously described, second mortgages are paid principal after the first mortgage and interest along with the first mortgage as long as the first mortgage is not in default. Second mortgages allow homeowners to borrow more against the value of their homes than they can through traditional first mortgages.
Fannie Mae and Freddie Mac standards for conforming mortgages permit secondary financing such as second mortgages on eligible mortgages however they must comply with specific LTV and combined loan-to-value (CLTV) set by the GSEs.
Secondary financing such as a second mortgage are generally used for various purposes including home improvements, debt consolidation, or accessing home equity. Another form of secondary financing is a Home Equity Loan which is a loan that is also subordinate to the first mortgage but is secured by the borrower’s equity in the home. Home equity loans come in several forms including a Home Equity Line of Credit (HELOC) which is a revolving line of credit, similar to a credit card, that is secured by the equity in the home.
Finally, Home Equity Investments (HEI) are a unique product that allows homeowners to access the equity in their homes without taking on additional debt. They are agreements between the homeowners and investors whereby the homeowners receive a lump sum of cash in exchange for a share of their home’s future appreciation.